Occupancy by Rate
Occupancy by Rate is a dashboard widget that shows how occupied your lots are over time, broken down by rate name. It gives you a visual heatmap of occupancy intensity across your entire date range so you can spot patterns slow periods, peak weeks, and everything in between at a glance.
Accessing the Widget
The Occupancy by Rate widget is available on the Dashboard. To access the dashboard, click the Dashboard menu under the profile icon in the top right corner of the screen.
Heatmap View
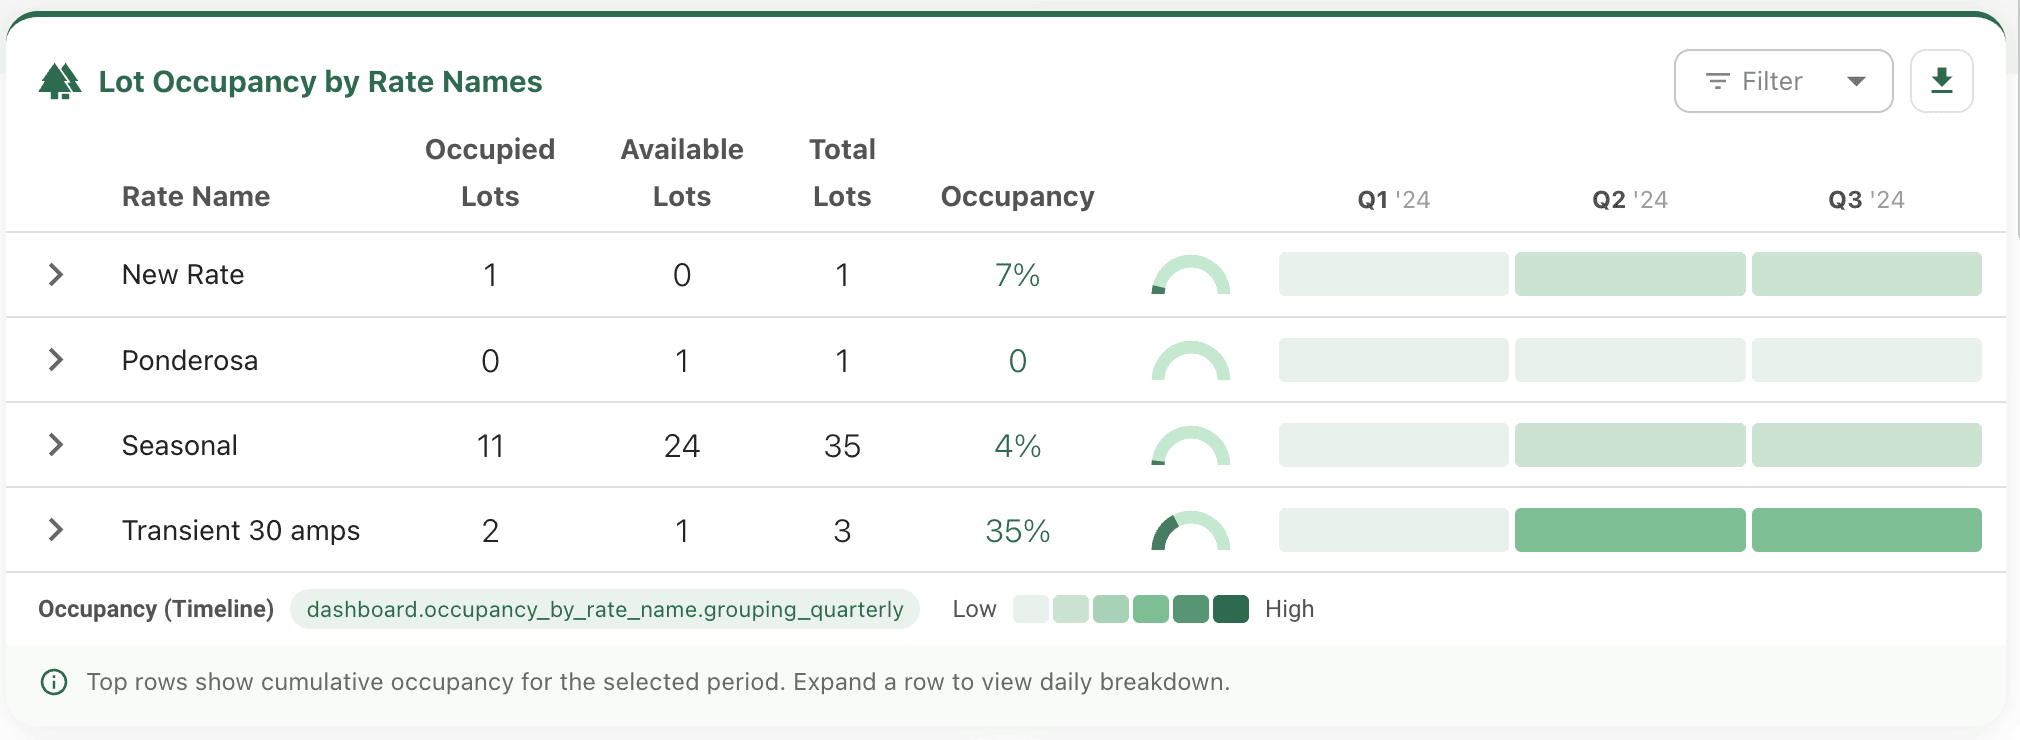
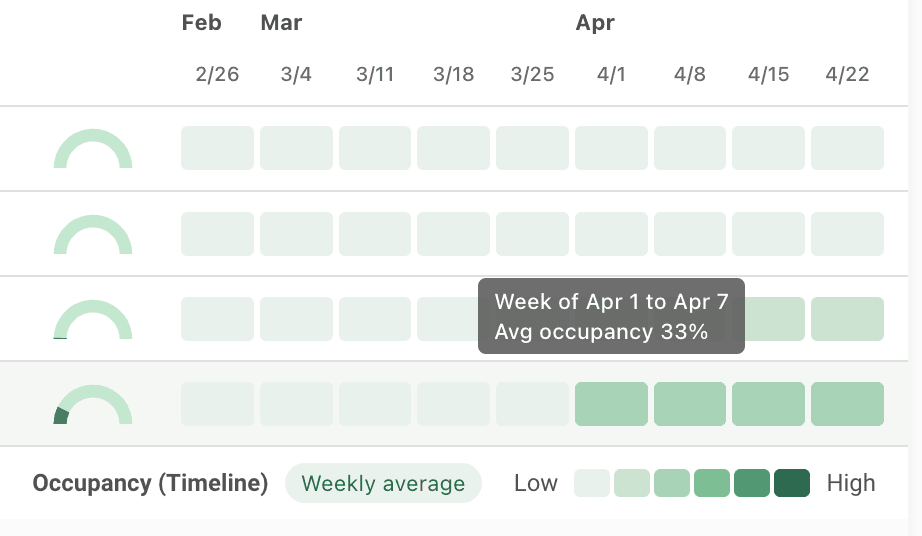
Each row in the heatmap represents one rate name. Each column represents a time bucket — daily, weekly, or monthly depending on the selected date range:
Cells are color-coded on a six-step green scale from light (low occupancy) to dark (high occupancy). Hover over any cell to see the exact occupancy percentage for that rate and period.
Filtering by Rate
Use the filter icon at the top of the widget to show or hide specific rate names. The filter opens a multi-select dropdown listing all your rates.
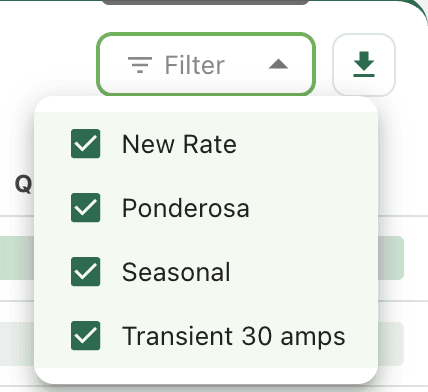
- Check or uncheck rates to include or exclude them from the heatmap.
- A badge on the filter icon shows how many rates are currently hidden.
- Your filter selection is saved automatically between sessions.
Expanding a Rate Row
Click any rate row to expand it and see a detailed daily breakdown for that rate.
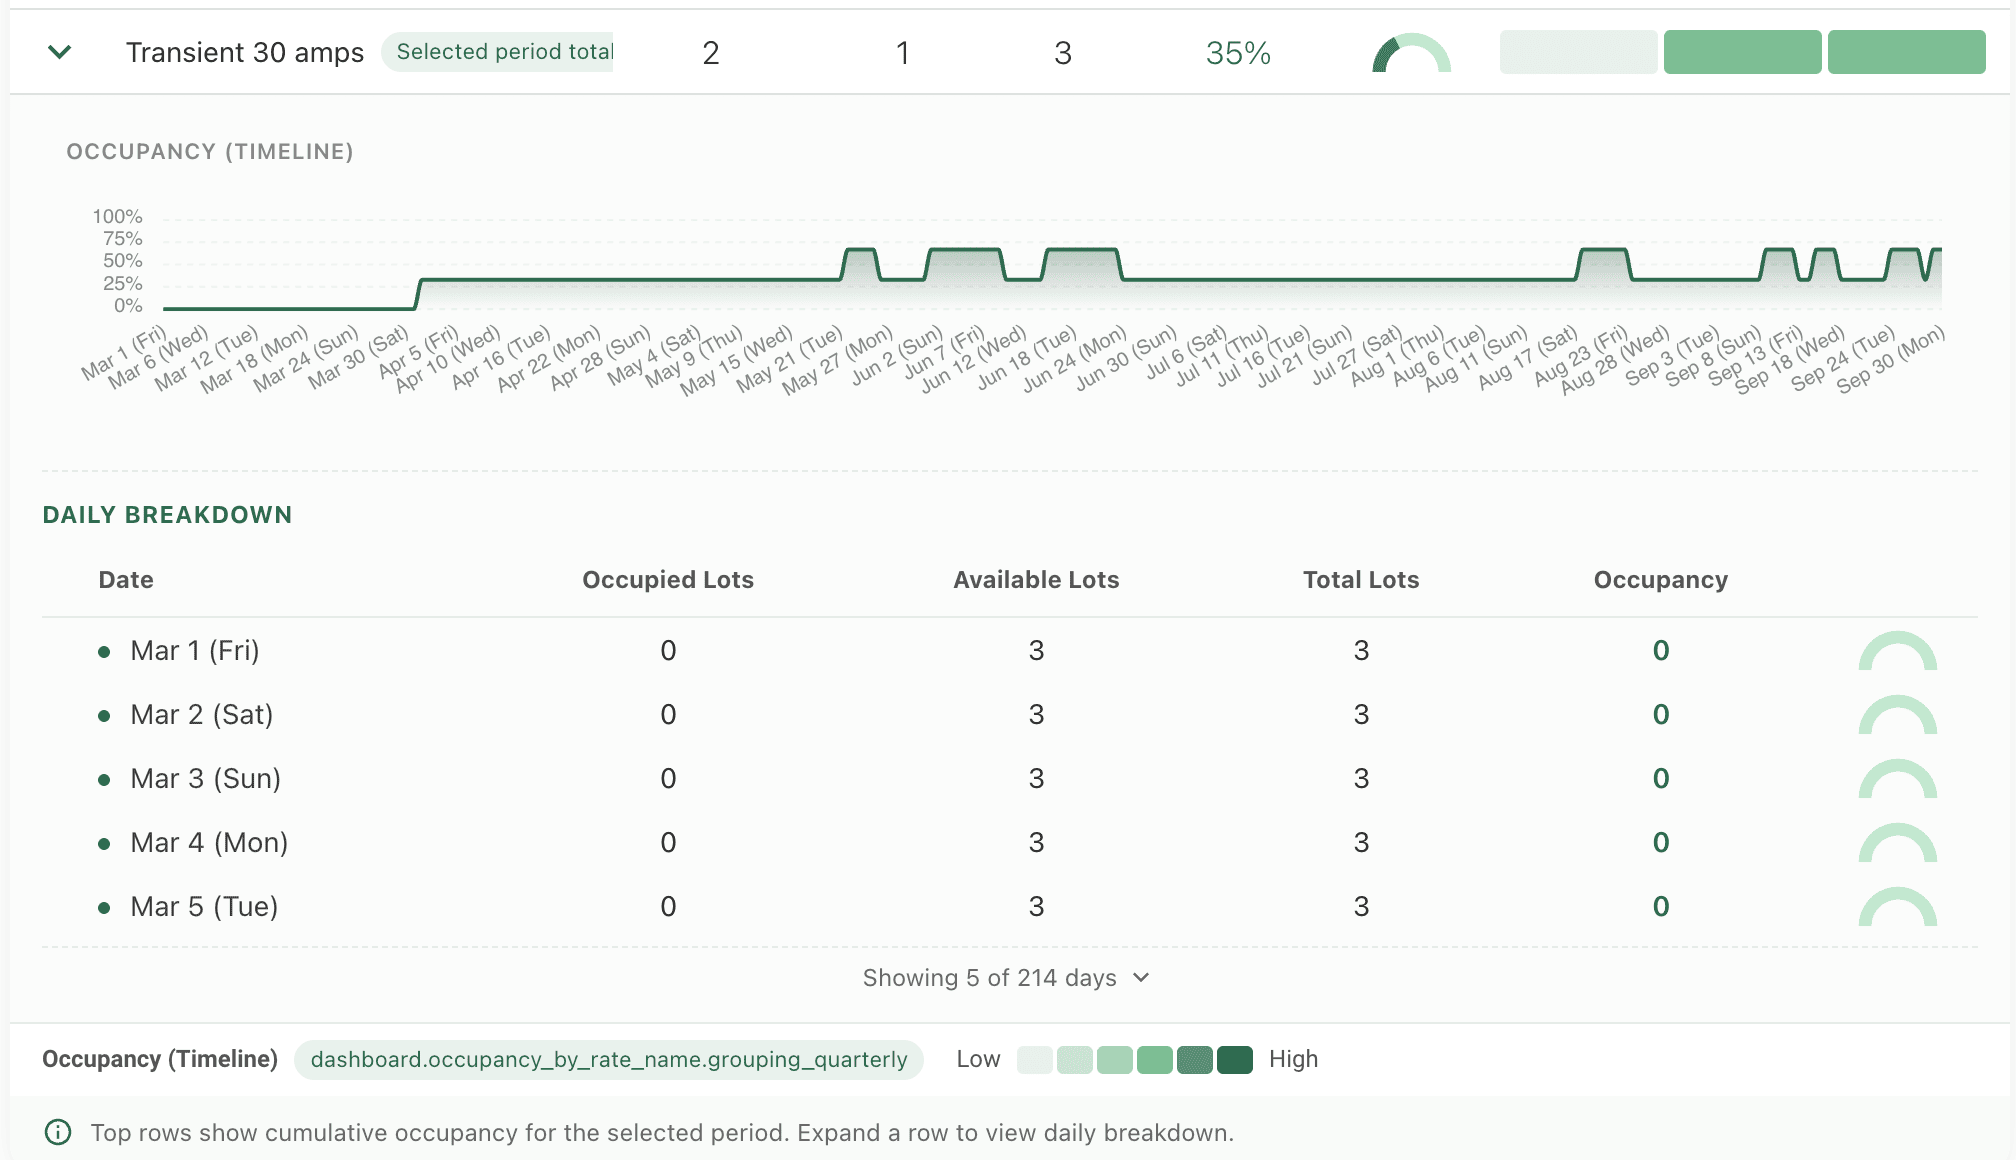
The expanded view shows:
- A line chart of the occupancy trend over the selected date range.
- A table listing each day with occupied lots, available lots, total lots, and occupancy percentage.
- A radial gauge for each day showing occupancy at a glance.
By default the table shows the 5 most recent days. Click Show all to display the full date range.
Exporting Data
Click the export icon at the top right of the widget to open the export menu.
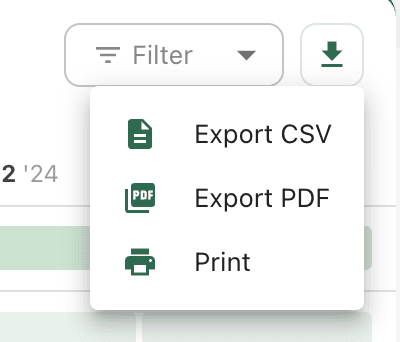
Three export formats are available:
| Format | Description |
|---|---|
| CSV | Downloads a spreadsheet with all occupancy data for the selected date range and rate filter. |
| Generates a formatted PDF report suitable for printing or sharing. | |
| Opens the browser print dialog with the report pre-formatted for printing. |