How Campgrounds Can Make Thousands More Per Season Using Data They Already Have
Quick answer: The campgrounds pulling ahead right now aren't doing anything dramatically different: they're just making pricing decisions based on their own occupancy data instead of habit and instinct. Every booking your campground has ever taken is a data point: when guests booked, how far in advance, which weeks filled early, which dragged. That history tells you exactly where your rates are too low, where you have room to move, and where shoulder days are quietly costing you revenue every season. The operators who read that data before setting rates for the year are consistently generating thousands more per season than those who don't.
Walk into any privately owned campground in February and you'll likely find the owner reviewing last year's numbers, maybe comparing them to the year before, and then setting this season's rates based on a combination of memory, gut feel, and what they think the market will bear.
That approach has worked for decades. It still works today, for the campgrounds in the middle. The ones at the top of their market are doing something different.
They're looking at the same data every campground accumulates (reservations, check-ins, occupancy by date, booking lead times) and using it to make deliberate pricing decisions. Not algorithmic. Not automated. Just informed. They know which weeks filled at 85% occupancy last year, which shoulder weekends surprised them by booking up in April, and which mid-July weeks underperformed despite strong demand signals. And they price accordingly.
The gap between those two approaches is where most campground revenue is being left on the table.
The Industry You're Operating In Right Now
The scale and growth of North American camping makes the revenue management opportunity larger than most independent operators realize.
The North American campground and RV park industry reached $10.9 billion in annual revenue in 2025, growing at an 8.3% compound annual rate since 2020, a pace that reflects sustained demand growth, not just post-pandemic recovery. (IBISWorld)
In 2024, 56% of campers reported struggling to find available sites due to full bookings, a demand signal that underscores how much pricing room exists at well-located parks that are already filling. (KOA 2025 Annual Camping Report)
Online booking is reshaping how guests arrive: online channels are projected to account for 61% of total campground revenue by 2030, up from 47.8% today. (Statista) Guests who book online compare prices more readily, arrive with clearer price expectations, and are more likely to book the park that reflects the value of their dates, not just the lowest base rate.
In Canada specifically, the combined RV and camping industry generates $20 billion in total economic activity and supports 141,400 jobs. (Canadian Camping and RV Association) Average nightly rates have grown 116% over the past decade, from $60 per night in 2010 to $130 per night by 2022 and continue to climb as operators respond to stronger demand. (CamperChamp Canada RV Statistics)
The campgrounds capturing that rate growth aren't just raising prices across the board. They're identifying the specific dates and periods where their data shows demand is strong enough to support higher rates — and pricing accordingly.
How Campgrounds Set Rates Today
Most independent campgrounds follow a version of the same process:
- Set a base rate for the season, usually close to last year's rate, adjusted up 3–5% for inflation
- Add a premium for known peak dates (Canada Day, August long weekend, maybe Victoria Day)
- Apply that structure to the whole season and move on to the next problem
It's efficient. It requires maybe half a day of work. And it captures most of the obvious revenue, the full weekends are priced up, the slow weeks are at base.
What it misses is everything in between.
The shoulder weekend that historically fills six weeks early: priced the same as a random mid-week night because it doesn't fall on an official long weekend. Demand is there. The rate isn't reflecting it.
The third and fourth week of August, which fill at 85%+ occupancy for most Canadian parks every year, priced identically to the first week of June. The season has been running for four months; demand is clearly established. The rate hasn't moved.
The regional music festival or provincial sports tournament 40 kilometres away that spikes mid-week occupancy in an otherwise quiet July window. The demand event exists; nobody set a rate for it because it wasn't on the radar when rates were set in February.
The final push in September, where the campground that dropped its rate by 15% to fill those last few weekends left thousands on the table from guests who would have booked anyway.
None of these are unusual situations. They happen at virtually every campground, every season. The difference between operators who capture that revenue and operators who don't is information — specifically, whether they looked at their own occupancy history before setting rates.
What the Data in Your Booking System Is Actually Telling You
Every campground running online reservations is generating detailed occupancy data year over year. Most operators look at their annual revenue totals and maybe their occupancy rate as a seasonal average. The granular picture is rarely examined.
Research from the hospitality industry, which has been applying revenue management far longer than the campground sector, consistently shows the scale of the opportunity. Hotels that implemented data-driven pricing strategies saw RevPAR (Revenue per Available Room) improvements of up to 16.8% in documented case studies. (Hotel Tech Report) Automated pricing applied to occupancy data has unlocked revenue gains of up to 30% in comparable hospitality contexts. (CloudBeds)
Campgrounds operate differently from hotels, guests are often repeat visitors with stronger price expectations, seasonal patterns are more compressed, and demand is driven heavily by a small number of peak periods. But the underlying dynamic is identical: the operators who know what their occupancy data says are consistently making better pricing decisions than those who don't.
That granular data sitting in your booking system includes:
Booking velocity by date. Which specific dates or weeks received reservations earliest in the booking window, sometimes five or six months in advance. Early booking velocity is one of the clearest demand signals available. If a particular weekend fills before Canada Day bookings even open, that date has pricing room that the base rate isn't capturing.
Occupancy by day of week, by period, by site type. Thirty-amp sites and premium waterfront sites behave differently. Weekday occupancy in the third week of August looks different from the same week in June. These patterns repeat year over year with remarkable consistency once you have two or three seasons of data.
Historical average nightly rate vs. historical occupancy. The relationship between what you charged and how full you were, day by day across the season. Where those two numbers diverge is where your pricing and your demand got out of sync.
Year-over-year trends at the date level. Was the third weekend of July stronger or weaker than the same weekend last year? Did it fill earlier or later? Is there a trend, or was last year an outlier?
Most campground operators could answer these questions from memory for their top five or six peak dates. They can't answer them for the forty or fifty shoulder dates that collectively represent a significant share of seasonal revenue, because the data is in their booking system, not in a format they've ever reviewed.
What Changes When You Actually Look at the Data
The operators who examine their occupancy history before setting seasonal rates consistently identify the same categories of opportunity:
Rates that are flat across periods where demand isn't. The base rate applies equally from May through October. Occupancy doesn't. The weeks in late July that fill at 90% and the weeks in early June that sit at 45% are priced identically, despite representing fundamentally different levels of demand.
Shoulder dates that perform better than they're priced for. The weekends immediately before and after peak blocks that fill faster than mid-week equivalents because guests extend their trips. These dates are priced at base rate because they're not "peak", but they behave like peak.
Event windows that repeat annually. Regional events that drove demand spikes in a prior year tend to repeat. A music festival, a triathlon, a provincial agricultural fair, if it moved your occupancy last July, it will probably move it this July. Pricing for it before the season opens costs nothing and captures meaningful additional revenue.
Weeks where a modest rate reduction would drive meaningful volume. Not every shoulder period is an opportunity to raise rates. Some are an opportunity to fill capacity that would otherwise sit empty. An operator who drops rates 10% for three weeks in September and fills 20 additional site-nights has made a better decision than one who held the rate and left those sites empty. The data shows which situation applies.
The common thread: none of these insights require sophisticated analysis. They require looking at the right numbers, occupancy by date, year over year, and making intentional decisions rather than defaulting to last year's rate sheet with a 4% increase across the board.
How PitchCamp's AI Price Strategy Tool Works
This is the gap PitchCamp's AI Price Strategy tool is designed to close, not by replacing your judgment, but by surfacing the data your judgment needs.
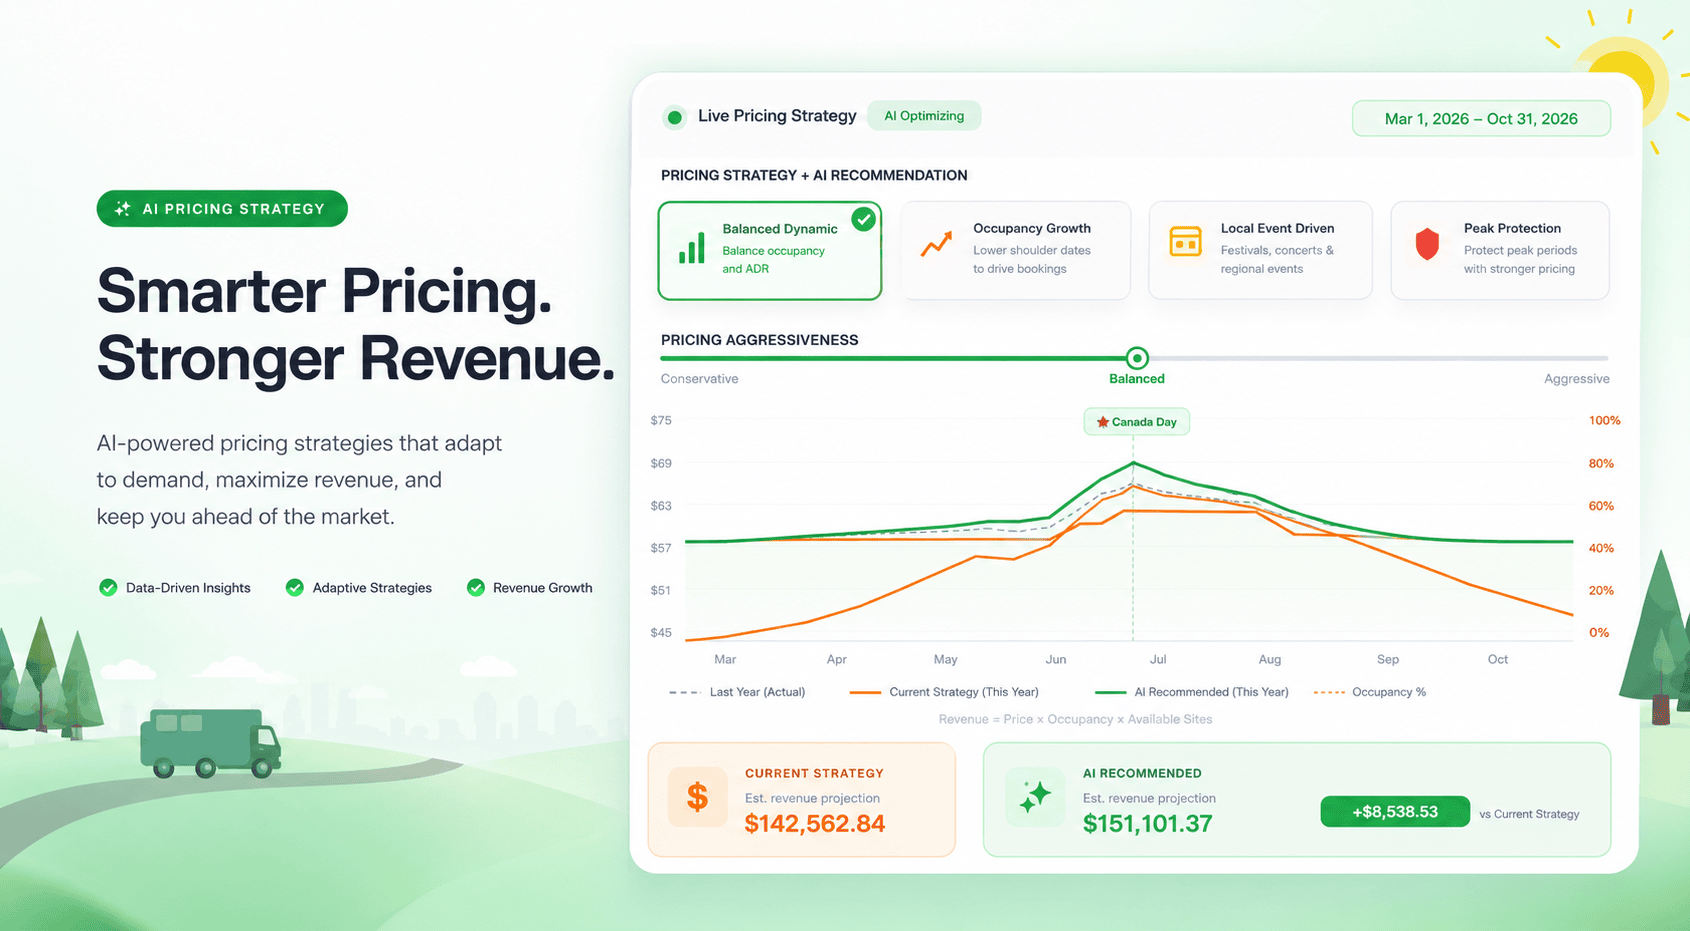
When you open the tool, you select your analysis window (a month, a quarter, the full season) and choose a comparison baseline: last season, this season, or your last 30 days. The tool then pulls your historical occupancy, your historical pricing, and your current rate strategy and renders them on a single timeline.
You see four data series on one chart:
- Last Year (Actual): what actually happened: your real occupancy and pricing, date by date
- Current Strategy (This Year): what you're charging this season
- AI Recommended: what the tool suggests, based on your strategy selection
- Occupancy %: your demand curve across the period
The shoulder days are immediately visible. The weeks where your occupancy curve rises but your pricing line stays flat, those are the dates the tool flags. The weeks where your pricing held but occupancy softened compared to the prior year, those show up too. You're not cross-referencing reports or building a spreadsheet. The pattern is on the chart.
Four strategy modes let you tell the system what you're optimizing for:
Balanced Dynamic moderates the recommendations, 5–15% adjustments based on your occupancy signals. A good starting read for operators who want a full-season view of where rates could move without committing to an aggressive stance.
Local Event Driven uses your campground's location alongside a curated dataset of regional events, festivals, concerts, sports tournaments, provincial holidays, and national long weekends, to identify demand spikes before they appear in your booking pace. It tells you the event name, its distance from your park, and why it's expected to affect demand, so you can make an informed call rather than just accepting a number.
Peak Protection identifies your sustained high-occupancy stretches and recommends strong rate increases — 15–40% — across the entire block, not just the headline long weekend dates. It holds shoulder pricing stable rather than discounting it, and often includes minimum-stay recommendations to prevent single-night bookings from fragmenting your highest-demand weekends.
Occupancy Growth works in the opposite direction for parks with shoulder-season softness: strategic 5–20% reductions on weak-demand windows to drive volume, with increases reserved for dates where occupancy is already strong. For parks that need to build booking momentum before optimizing per-night rate.
A pricing aggressiveness slider, Conservative to Max, controls how bold the recommended adjustments are. You can run the same date range at Level 2 and Level 4 and compare the estimated revenue output. The difference tells you how much pricing headroom you're currently leaving at the conservative end.
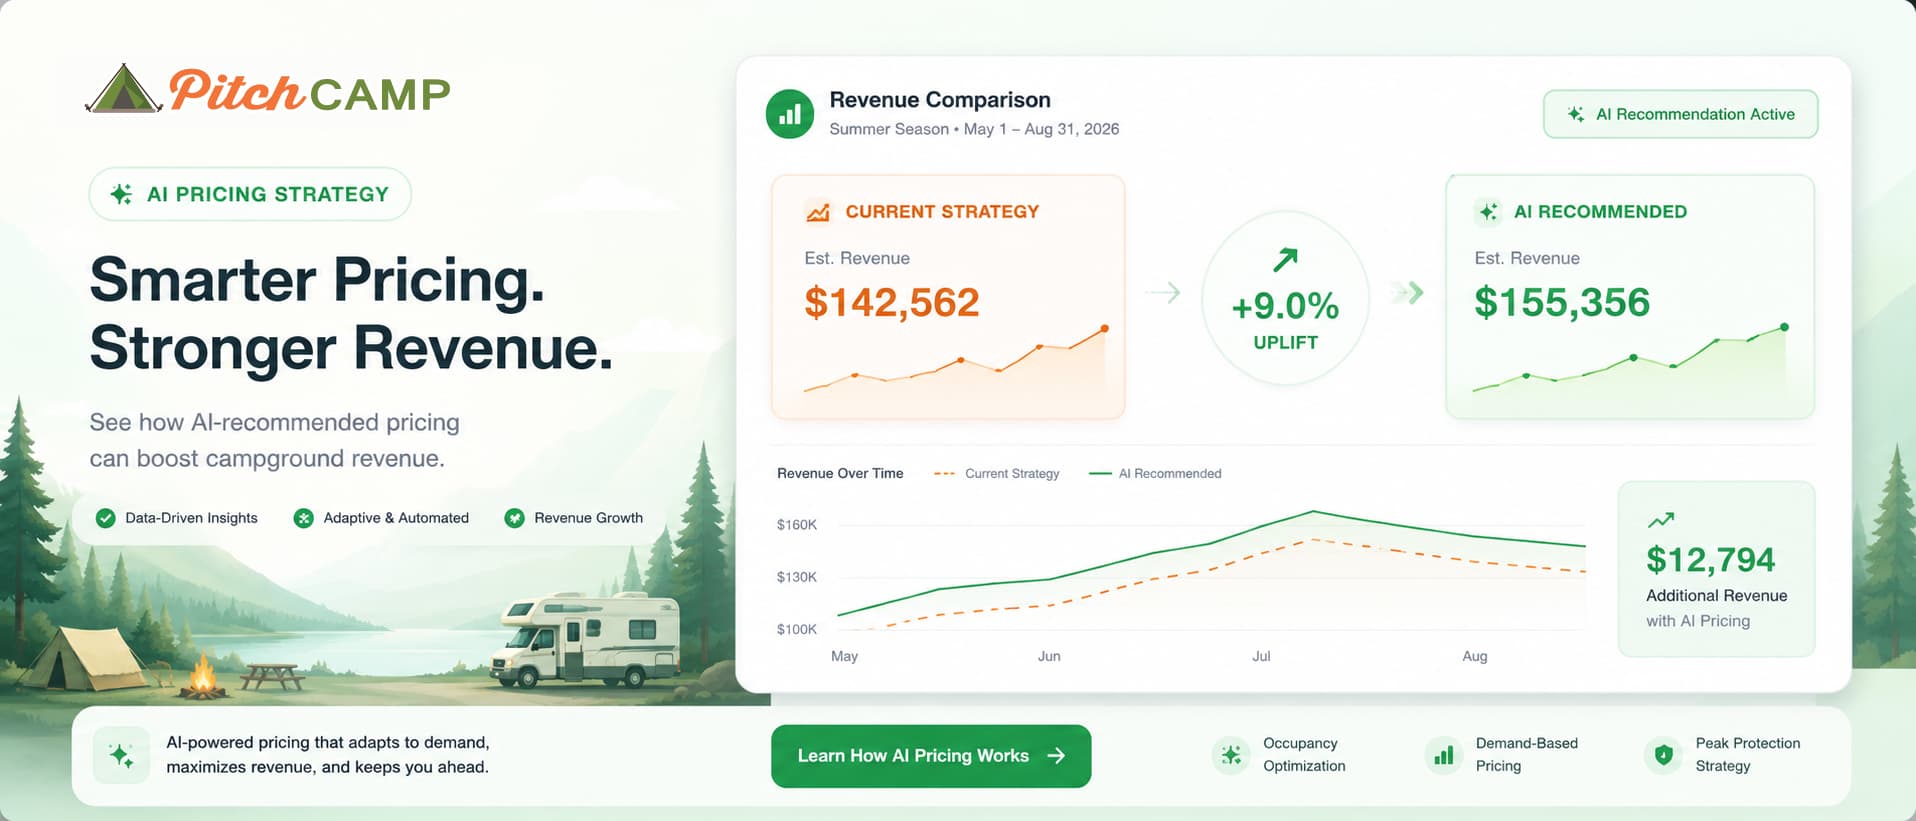
Below the chart: two revenue totals for the full period. Your current strategy, estimated. The AI recommendation, estimated. The difference.
On a single 30 Amp tier across a full March–October season, the Balanced Dynamic strategy at a moderate aggressiveness setting projects \(142,562 under current pricing** and **\)151,101 under the AI recommendation, a seasonal lift of +$8,538 on one site type. Across a full inventory of site types, the cumulative delta for a mid-sized Canadian campground is commonly in the range of $15,000 to $35,000.
When you're ready to act: Apply Suggested Pricing converts the recommendations into scheduled rate rules for your review. Nothing goes live until you confirm. You can apply all of them, a subset, or simply use the output as a reference for configuring rates manually. The decision, and the context behind it, stays with you.
The Campgrounds That Will Be Best Positioned
The campground industry is in the middle of a meaningful shift. Guests book online, compare rates across platforms, and arrive with a sharper sense of market pricing than they had five years ago. The transparency that used to work in favour of operators who priced by feel is now working against them.
The campgrounds navigating this shift well aren't necessarily the largest or the best-capitalized. They're the ones treating pricing as a decision informed by data, not an annual habit. They're reviewing their occupancy history before the season opens. They're identifying the shoulder dates that deserve a rate adjustment and the slow weeks where a strategic reduction pays off in volume. They're capturing the revenue from regional events that their park didn't even know was on the calendar.
None of this requires changing how your campground operates. It requires changing how you approach one decision, rate setting, by looking at what your own booking history is telling you before you make it.
That data is already in your system. The operators who read it are the ones pulling ahead.
Frequently Asked Questions
How much additional revenue can AI Price Strategy identify?
Most campgrounds identify between $6,000 and $35,000 in projected additional seasonal revenue across all site types within their first analysis, depending on park size and current pricing gaps. A single 30 Amp tier analyzed across a full March–October season commonly shows between $6,000 and $10,000 in projected lift. The estimate is grounded in your own historical occupancy data, it's directional, not a guarantee.
Do I need to change how my campground operates?
No. The tool works within your existing site inventory, rate structure, and booking workflow. The only change is that your rate decisions are informed by occupancy data rather than instinct alone. No new staff, no infrastructure changes, no changes to how guests book.
Which pricing strategy should I choose?
Start with Balanced Dynamic for a full-season view of where your rates could move. Switch to Local Event Driven if your park is near festivals, sporting events, or draws heavily on Canadian long weekends. Use Peak Protection if your main goal is maximizing revenue on dates you know will fill. Use Occupancy Growth if you have persistent shoulder-season softness you want to address first.
Does applying recommendations change my rates immediately?
No. "Apply Suggested Pricing" creates scheduled rate rules that you review before they go live. Nothing changes until you confirm the output. You can also apply only a subset of the recommendations.
Can I run the analysis for different site types separately?
Yes. The analysis runs per rate base, so your 30 Amp sites, 50 Amp sites, water and sewer hookups, and tent pads can each use a different strategy and aggressiveness level based on their individual occupancy patterns.
What data does the tool use?
It draws on the booking history already in your PitchCamp account, occupancy by date, historical pricing, booking velocity, along with your current rate configuration. No external data imports or manual setup required. The more seasons of history in your account, the more precise the analysis.
Related Reading
- Dynamic Pricing for Campgrounds, Does It Actually Work?
- Stop Guessing What to Charge: A Campground Pricing Guide That Actually Makes Sense
- How to Maximize Revenue on Long Weekends Without Angering Regular Guests
- The Numbers Every Campground Owner Should Track
Your pricing data has been accumulating for years. It's time to use it.
AI Price Strategy is available in PitchCamp's Rate Management section. Open your first analysis in minutes, your occupancy history is already there.
Book a Free Demo or Start for Free, free to get started. 🍁
Tags: campground pricing strategy Canada · campground occupancy data · AI price strategy campgrounds · increase campground revenue · campground revenue optimization · shoulder season pricing campground · data-driven campground pricing · PitchCamp AI pricing